
April 2018
I have written an accurate simulator of the iOS puzzle game SPL-T, suitable for simulating and analyzing large sets of games. While an optimal playing sequence for SPL-T very likely exists, I will show that it is not possible to find it with a simple brute force approach. Despite that, with a slightly modified brute-force approach I was able to set a new record of 1027 moves. I will also prove that even longer games (at least 1058 moves) are possible.
SPL-T is a puzzle game released by Simogo in 2015 for iOS devices. Everything Simogo has made so far is wonderful and quirky, and while SPL-T was quite a departure from their usual fare, it's very good. Try a few rounds... the following writeup will be a lot more meaningful to you if you have some context.
A game of split starts with a box 8 units wide and 16 units tall. You begin by splitting the box in half horizontally, so that the game board now consists of two 8x8 blocks.
Then you choose one of these two blocks to split in half, but now the split will be vertical.

This continues for as long as you can manage: pick a box to split in half, the split direction alternates between vertical and horizontal. You may not split a box into a height or width of less than one unit. This alone would make for an uninteresting game, so there are some extra mechanics:
That's all. The aim of the game is to keep going for as long as you can. Described like this, it might not sound like the most exciting video game in the world. But it's surprisingly deep and fun to play. As the official marketing copy goes:
We know. It doesn’t look like much. But we promise that it’s a very good puzzle game. Like, really good.This is a true single player game, there is no opponent. A particularly interesting aspect is that there are no random elements to the game. A given sequence of splits will always produce the same outcome.
This observation grew into a bit of an obsession for me. If there is no randomness, then there must exist a best possible play sequence. How long is it, and why? You can make a handwaving argument that games should not be able to go on forever: point blocks take on progressively larger values the longer you play, and so they also take longer to clear. Eventually they will choke out the board, but when? Could you find the longest possible sequence by asking a computer to brute-force play all possible games?
Let me share with you what I learned along the way.
Footnote: In this writeup I am only interested in game lengths, but there is also a scoring component. Every split earns one point. Every decrement of a point block goes into your score (which includes halving events when point blocks fall). When a point block vanishes, you are given points equal to its area.
Before we get started, it would be helpful to survey the field for some context. There is no official leader board, and game scores are kept local to your device. My sources are people bragging on Twitter or the TouchArcade forums, so this is not an authoritative list but it's a start. As of December 2017, here is the top 10 according to my search:
| Rank | Name | Game Score | Game Length |
|---|---|---|---|
| 1 | @baronvonholbach | 606051 | 973 |
| 2 | bamako | 549368 | 954 |
| 3 | @michalboo | 502785 | 911 |
| 4 | @palevich | 453245 | 869 |
| 5 | @simei89ss | 436448 | 868 |
| 6 | @hzlrbbt | 449653 | 865 |
| 7 | @chriszka | 413055 | 843 |
| 8 | @mangosquash | 379116 | 804 |
| 9 | floplus | 381621 | 801 |
| 10 (tied) | @thesymmetrist | 376176 | 792 |
| 10 (tied) | @ewr24 | 371340 | 792 |
A plot of the top 20 scores looks like this:

If you've played SPL-T, you'll recognize that these are impressive scores! A game shorter than 600 splits doesn't even get you into the top 20. Notice also that there is a fairly good correlation between score and length, with no outliers. This suggests that nobody made a low-effort fake when posting their numbers.
Given Simogo's reputation for surprises, there is occasional speculation that something interesting might happen if you manage to reach 1000 splits. Players like bamako and @baronvonholbach have come tantalizingly close, but as far I can tell nobody has managed it yet. I will therefore specify a 'victory condition' of this project: find a playing sequence which lasts longer than 1000 splits.
For this project to work, I need to be able to play a lot of games of SPL-T, unsupervised and very quickly. The only way to do that is to write an accurate SPL-T simulator.
My language of choice for this is Python. I only need to recreate the back-end game logic; graphics or input are not needed since no human will be playing with the simulator. I described the game mechanics above, and since they are quite simple it was straightforward to get 95% of the way there. The final 5% drove me crazy, and stems from the last rule:
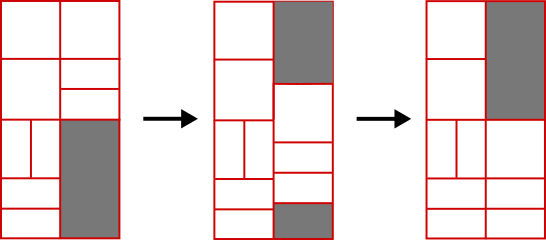
If this vanishing and/or falling leaves a void at the top of the board, fresh blocks will be introduced to fill them.
The issue is that there can be more than one way to fill a void. For example, say we need to fill a rectangular void 4 units wide by 6 units deep. It won't be filled with a single 4x6 block, because a side length of 6 is illegal: all blocks must be cleanly splittable in half down to size 1x1 (put another way, side dimensions must be 2n, n integer). So will it be filled by a 4x2 then a 4x4 block, or a 4x4 then a 4x2 block?

Situations like this get even more complicated with 'T' shaped voids and so on. For our purposes it is essential that the simulation behaves identically to Simogo's game, and it took a lot of trial and error to make the filling logic accurate.
But well, the details of this are uninteresting. I got there in the end, and you can look at core.py if you want more details (gitlab page) . Throughout the following I will be referencing various playScripts, which use the core simulation file to play games in different ways and measure different things. You can run these yourself to reproduce what I will show here, or use them as a template for running your own experiments. To give you a sense of the throughput, a computer with a newish 4-core CPU can simulate 2-3 million randomly played games in 24 hours.
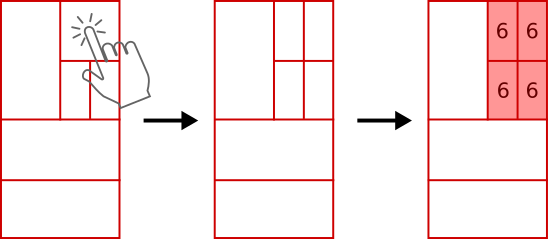
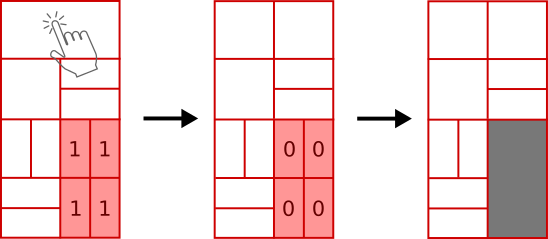
In the process of running these simulations, you might want to verify the accuracy of a given sequence by replaying it manually on your iOS copy of SPL-T. You can do this with the help of replay.py. It will draw you a picture of the SPL-T board and highlight which box to choose next, so that you can follow along on your device:

If we just pick moves at random, for millions of games, what's the outcome? To run such a simulation, you can execute playScript01.py
If you let it run for 50 million games, the results will look like this:

Some observations:
The most telling visualization is a histogram of game lengths:

It contains two peaks corresponding to odd and even length games. They're not exactly Gaussian, but a Gaussian fit gives us a reasonable estimate of peak positions (μ) and standard deviation (σ):
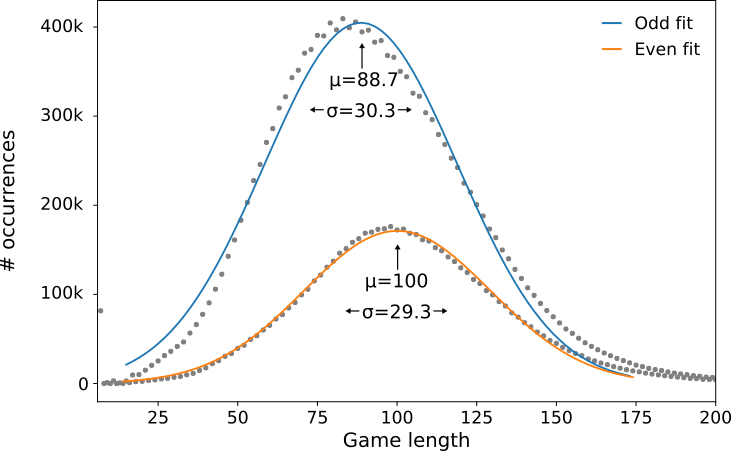
First I need to clarify that this histogram corresponds to playing randomly. It does not mean that of all possible paths through SPL-T, most terminate at or around 100 moves. What we are seeing is the true distribution of all possible paths, convolved with the sampling distribution we get from playing randomly. In other words: substantially longer paths exist, but we're not going to find them by playing randomly like this.
This histogram has the added benefit of establishing a performance metric for SPL-T: if your personal best is a game longer than 130 moves, you are at least one standard deviation superior to an ape bashing the screen randomly. It also clearly tells us that a strategy must exist, because by this metric the highest reported human scores are 29 standard deviations better than playing randomly!
To make progress towards finding a 1000 split game, we're going to have to get a little bit smarter.
Diversion: Why are there two peaks, with different positions and amplitudes?
As was already illustrated in the plot, the two peaks correspond to odd and even length games. Most games ended after an odd number of moves, and the even-length peak was centered on a longer length.
You start every game by making a horizontal split. Your second split is vertical, third is horizontal etc. So an odd length game means that the last split you made before running out of moves was horizontal. Equivalently, we could say that an odd length game ended because you weren't able to make a vertical split.
It seems reasonable to suspect that the aspect ratio of the board might be involved. For example, if we think about playing not on an 8x16 board (width x height) but on an 4x8192 board, vague intuition suggests that you might tend to run out of vertical split options more often than you run out of horizontal split options, and so the game lengths would skew odd. That might explain why there are two peaks with different amplitudes.
It might also explain why the peaks have different positions. The y axis can be loosely interpreted as 'probability that the game ends after this many moves'. If the board aspect ratio dictates that there are many more horizontal split options than vertical, we will have to play for longer before we use them all up and games start ending due to a lack of horizontal splits.
Since these games are being simulated and we have control of the game rules, we can easily look into this. We can continue to use playScript01.py, we just pass it different board size parameters when calling it. Note that only certain board sizes are 'legal'; if the width or height are not 2n (n integer) then we will eventually run into a situation where we have an odd-length block, and the 'split in half' operation is then not possible without making fractional blocks
The result of such an experiment is summarized below:

Where the labels are (width x height). It's immediately apparent that yes, aspect ratio is involved. Even length games dominate on wide boards (e.g. 32x8) and odd length games dominate on tall boards (e.g. 8x32). The smaller peak usually comes at longer game lengths.
The board size Simogo chose (8x16) was probably dictated by the aspect ratio of iOS devices (close to n x 2n in portrait mode). But it's nice that this happens to result in games with fairly 'balanced' end conditions. It is however interesting to note what happens along the (n x 2n) diagonal (i.e. 4x8, 8x16, 16x32, 32x64). Despite a fixed aspect ratio, as the board size grows the even/odd distribution doesn't just equalize, it reverses! (compare 8x16,16x32 and 32x64). I don't have an explanation for this. If you have any insights or thoughts, email me.
What if instead of choosing moves at random, we try to exhaustively play through all possible move sequences? Then you would of course also know the longest possible sequence.
For that discussion, we should first talk about what a "tree" is in the present context. A tree is a way of representing all possible paths through a game of SPL-T. The clearest explanation is to show you a diagram containing the first few levels of the tree:

Nodes are valid game board configurations, and arrows represent choices you could make of what to split on that gameboard. Every move takes you down one level in the tree.
Define the branching factor of any given node as the number of arrows (=move options) leaving that node.
To get a feeling for what we are dealing with with the SPL-T game tree, we can play a bunch of games and keep track of the branching factors. To run such a simulation, you can execute playScript02.py, which will play many games randomly and produce a 2D histogram of the branching factor:

Here I have rescaled each column to a maximum height of 1. This is not the same as normalizing, and the resulting z-scale is not directly equivalent to probability. But this approach makes it visually obvious where the weight of the probability peak is.
After climbing to about 12, it eventually settles into something around 5. This is terrifying. To see why, let's take a conservative approximation and say that the branching factor is a constant 4. After n moves, this means that there are 4n unique board configurations. My stated aim is to find a 1000 split game, and 41000 is, for all practical purposes, the same as infinity. Based on this assessment, it is absolutely not possible to exhaustively search the game tree.
To put this in perspective: if every atom in the universe (≈1080) were a computer, and these computers were a million times faster than the one I am using (so ≈50 million games/second), and they had all been simulating SPL-T games for the entire age of the universe (≈14 billion years), they could only have comprehensively explored the game tree to a depth of 100 moves.
We can nonetheless cling to two hopes:
Hope #1: Measure the tree size
Even though we just established that the tree is enormous and we can never fully explore it, it can't hurt to take a look anyway. Maybe we're in luck and it does indeed start to shrink before growing too big. Let's try recursively traversing the entire tree up to a fixed depth. This is performed by playScript03.py.
In the early stages of the game the branching factor as a function of move number n is approximately n. An upper bound for the number of game states after n moves is then (n!). How does the real game tree compare?
| Move number | # nodes (n! upper bound) | # nodes (measured) |
|---|---|---|
| 1 | 1 | 1 |
| 2 | 2 | 2 |
| 3 | 6 | 6 |
| 4 | 24 | 24 |
| 5 | 120 | 120 |
| 6 | 720 | 704 |
| 7 | 5040 | 4800 |
| 8 | 40320 | 34128 |
| 9 | 362880 | 281632 |
It grows slightly slower than (n!), but still alarmingly quickly. If you wanted to use a tree search algorithm which required the entire game tree to be kept in memory, and we over-optimistically assume that a game board state can be saved in just 1 byte, you could only map to a maximum depth of 13-14 moves. Just a reminder, we're targetting a 1000 move game.
Hope #1 dashed: No, the tree does not start shrinking fast enough for exhaustive mapping to be computationally feasible.
Hope #2: Symmetry reduction
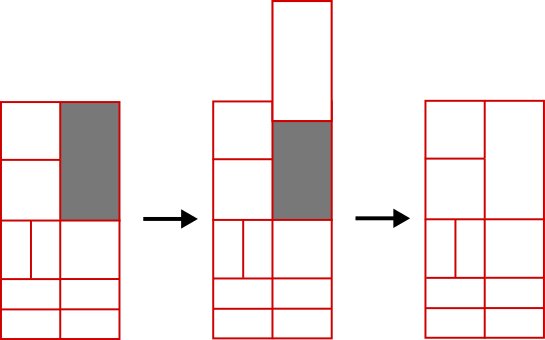
Notice that some game mechanics in SPL-T have a dependency on vertical positions (blocks falling and filling), but none depend on horizontal positions. This effectively makes some pairs of boards duplicates of each other. For example, if two boards are mirror symmetrical about the vertical middle axis, then as far as the game mechanics are concerned these boards have identical futures:

If during a game we look through the list of available moves and eliminate any which would result in a symmetry duplicate, how much would we reduce the branching factor and hence search space?
For this you can run playScript04.py. It repeatedly plays random games, with no memory. Every turn, it tests all the moves it has available (i.e. explores 1 step forward). If any of these 'future' boards are equivalent by symmetry, it flags a redundancy: two of your choices lead to the same outcome.
As output from this script we get a list of how many times a redundancy was found for each turn number, as well as how often that turn number was reached. For example, it might tell us that move #6 was reached in 500 trials, and in those trials a redundant choice was found 32 times.
Real output looks like this:

On the 3rd move there is always a redundant choice (this corresponds to the board depicted in the diagram above). But the probability of encountering redundancy drops off exponentially after that! Beyond 17 moves in, no redundant choices were found in 20k trials. It seems that there is relatively little to be gained from symmetry culling once you're deep into the tree.
Hope #2 dashed: No, the branching factor cannot be cleverly reduced (at least not like this)
Footnote: I actually did try tackling this with a Monte Carlo tree search, but for all the obvious reasons discussed above it was not helpful. In principle with MCTS the search should continually improve as you build up the tree, but if the algorithm is only sparsely sampling the tree then it performs no better than random. And you can't just leave it running for a long time to increase the sampling, because you will run out of memory.
In the 50 million random trials, the longest game we found was 367 moves.
Presumably this game ended at 367 because a bad decision was made near the end. Imagine that we rewind the gameboard to how it looked after (367-n) moves. I will call the original 367 sequence a local maximum if it is the longest possible path when starting from that rewound game state.
For any given sequence, it seems plausible that it could be a very local maximum if we only rewind by 1 or 2 moves. But given how vast the game tree is, what do you think the chances are that our sequence is still a local maximum if we rewind 50 moves? Maybe something like 1 in 450, right? Vanishingly unlikely. This implies that in the neighbourhood of where your path ended, there is almost guaranteed to be a longer path. If you look carefully, perhaps you'll find it.
In playScript05.py I explore this idea. It goes like this:
There are several parameters to tune here, and it's not obvious what optimal values are - I did a lot of hand tuning as I went based on vague intuition. The main trade-off is that if you let it rewind too aggressively, the search space becomes intractably large and you are unlikely to find a better path. (If that's not obvious to you, think about the limiting case of rewinding all the way back to zero - we know based on the preceding discussion that this doesn't perform well). This argues for taking small rewind steps and playing a lot of games at each rewind step. But if you don't rewind aggressively enough, you waste time stuck in your local maximum.
This approach is still completely absent of any kind of meaningful playing strategy, it still takes a long time (days) and there's still an element of luck. But it performs much, much better than playing purely randomly with no memory between games. Here is a typical example of a 12 hour run starting from a fresh board:

The algorithm found a sequence of length 578 in under 12 CPU hours, a substantial improvement over the random playing in Section 1, where we found a maximum of 367 in nearly a month of CPU time!
Encouraged, and needing to find a 1000+ sequence in order to have some closure on this obsession, I let this run for a little while longer. How did it go?

1027! Mission accomplished! I hereby stake my claim for the title of 'SPL-T world champion'. While this title is unconfirmable, the game itself can easily be confirmed: run replay.py passing it the saved sequence in sequence1027.txt, and it will replay this sequence for you. Carefully follow along with your iOS copy and you'll get the same score.
As far as I can tell, the previous record was 973 splits, set by @baronvonholbach. In addition to posting his final score, he did something a little unusual and posted screenshots of the board when he was 800 and 901 moves into the game.
We can do something interesting with this. By manually entering the board configurations and running the 'local maxima search' from that starting point, we can figure out if he could have done even better than 973. You can run this yourself (playScript06.py), and you will almost immediately learn that the answer is yes. If you run it for a while, it is possible to reach at least 1058 from his board at 901, for a score of 695705. (Of course, these sequences you cannot verify since you are missing the record of how to reach that starting 901 board from scratch)
Does that make the actual world record 1058, and if so does @baronvonholbach have the majority (85%) claim to it?
The big question I had when going into this project was 'what is the longest possible game of SPL-T'. I achieved my sub-goal of a 1000+ splits, but the big question remains open. We have seen that this is not something that will be resolved by dumb brute force. If someone were to implement a meaningful playing strategy, they would probably blow this 1058 record out of the water, and I'd be happy about it. But still, there is a difference between finding a very long sequence and proving that you have the longest possible sequence. I hope that the scripts and discussion here motivate others to try their own experiments and algorithms - it's an interesting and accessible topic.
Lastly: remember that branching ratio image plot in Part 2 which told us that it's around 4? I'll leave you with a beautiful picture: the same type of plot for a 32x64 game board. The branching ratio for the first 1000 moves seems to be more like 100 (!)

(All analysis and plotting was done in Python with matplotlib, tidied up in Inkscape. Scripts and a jupyter notebook are available on Gitlab)